Analysis of Airbag Image Sequences
The analysis program FalCon etra MovBag extracts the outlines from airbag test scenes and derives related measurement values.
Main features
- Automatic measurement of time-varying contour graphs.
- Display in the image overlay and diagram
- Evaluation of specific measurement values:
maximum expansion, area, center of gravity (output and display according to analysis system etra MovXact) - Measurement of discrete points, markers or areas/patches
- Calibration of results with free choice of the coordinate system
- Export to Multi-D format, DIAdem® etc.
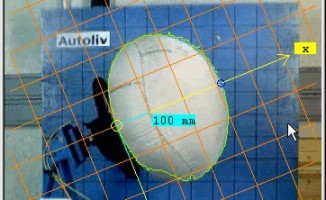
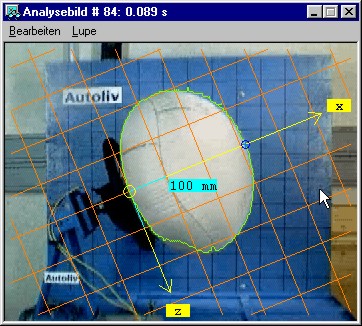
 The analysis program etra MovBag offers automatic measurements of airbag outlines as contour graphs = f(t). The available image processing tools are designed principally for blow-ups in a test environment; measurement methods detect differences regarding brightness and color saturation (absolute and relative to a reference image). All thresholds and parameters are adjustable.
A mainly automatic measurement requires the following boundary conditions:
- The airbag surface is illuminated appropriately and is "bright" (in relation to the near environment).
- A white balance according to the color of the bag, e.g. silver, ensures a "non-colored" appearance of the airbag, i.e. the color saturation is low.
- The background of the scene should show a pattern helping to separate the airbag surface. Thus a (relatively) "dark" and "colored“ (as possible homogeneous) curtain is recommendable. Measuring within a monochrome image sequence (KODAK 4540), the brightness gradient between background and airbag should be considerable.
- Bright or even white labels, bars etc. in the region of interest should be avoided. Nevertheless the user may select a detection area to mask-off non-relevant regions in the scene, e.g. visible spotlights.
- In version 1.0 the image background is assumed to be static. To measure within dynamic tests (= moving sleds) the module will be extended: trajectories (as a result of etra MovXact) allow a reference to a "running" background.
Components
- The outlines are displayed in the image overlay: options are e.g. color, filling, background mask, coordinate system with axes and grid.
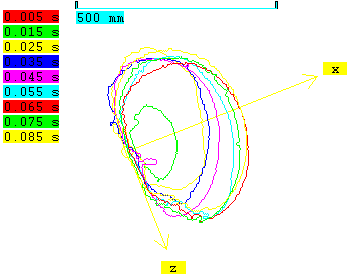
- An overview sketch with legends helps to log the temporal course of the expansion: options are sequence interval, increment and background mask.
- Calibrated graphs can be displayed as x-y diagrams or exported into table or standard files (DIAdem®).
- A new Multi-D data format enables a visualization as temporal sequence of 2D diagrams. Several of these diagram sequences can be displayed synchronized to AVIs, thus a comparison of different tests is possible. Of course the modules QuickView and CustomerView support this data format too.
- Specific measurement values are extracted from the contour graphs: maximum expansion, area and center of gravity (extendable on demand). These measurement values are calibrated and post-processed according to the extensive features of the analysis system MovXact. Results are output numerically and as time diagrams.
| 型號 | 概述 | 詢價數量 |
|---|